We accept:

How to check your PC CPU temperatures
This form is protected by reCAPTCHA - the Google Privacy Policy and Terms of Service apply.
Don't have an account?
Creating an account has many benefits: check out faster, keep more than one address, track orders and more.
If your CPU temperatures are in meltdown, it can cause a whole heap of problems for your system. That’s why the experts here at Fierce PC have put together this handy guide on how to check and monitor your PC CPU temperatures, so your system can remain cool, calm and collected, even under the most intense workloads.
Why monitor CPU temps?
Has it been a while since your last PC upgrade? Is your PC running painfully slow or even worse, just keeps shutting down? Is the system that once stayed ice cold, no matter what, now hot to the touch, even on loading screens? Then it might be time you considered checking your CPU temperatures.
Monitoring CPU temps is an essential piece of gaming PC maintenance, and while you don’t need to be doing it every day, it should form a semi-regular part of your ongoing care for your system. This is especially true if you frequently put your PC under heavy loads, or you’re an avid overclocker, or if you happen to notice performance issues creeping in.
If your CPU gets too hot, you can run into thermal throttling issues, drastically reducing your systems performance. You might notice your PC starts to become noisier than usual or it might even start shutting down unexpectedly. Long term, you could even be doing irreparable damage to your PC and components.
Luckily, monitoring your CPU temperature can alert you to any potential issues before they get out of hand, and can even make you aware of other system issues such as viruses, so you can see why it’s something we recommend doing!
What are good CPU temps?
Before we get into the nitty-gritty of how to monitor temperature, it’s important to know what ‘good’ looks like. This will give you a baseline so you can quickly identify if your CPU is staying within an acceptable range, or if you may need to do some troubleshooting.
Your specific model of CPU will have its own specific safe operating temps, so we always recommend reading the manufacturers specifications. This will also tell you your CPUs maximum safe temperature, which can be useful to know if you want to stress test your system. In most cases, CPU temps look like this:
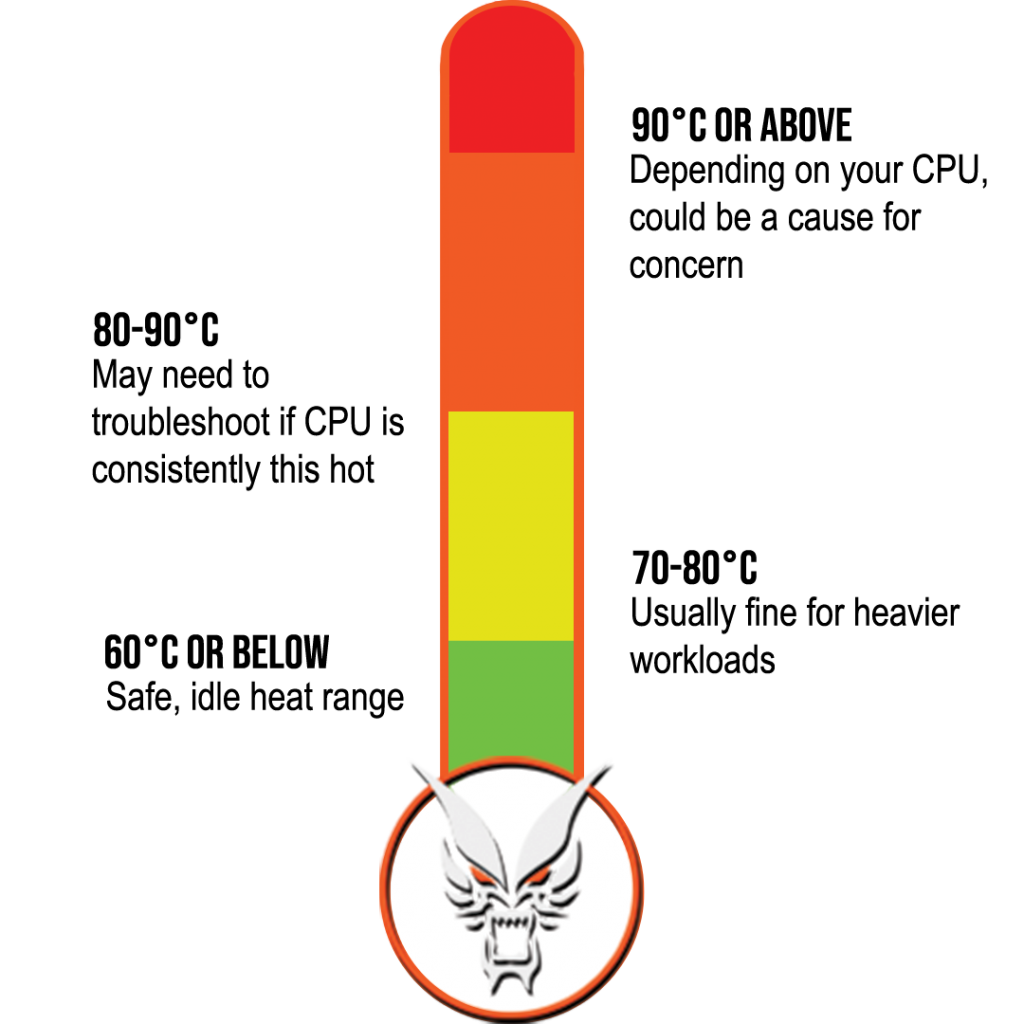
60°C or below: A ‘safe’, idle heat range, typically seen when performing light workloads
60-70°C: Indicative of a system under load. You might see temperatures like this when gaming or running more intensive applications such as video editing. When testing your CPU temperatures, it’s typically this load temperature range that you will want to test in to ensure your cooling is working adequately.
70-80°C: This is usually fine for heavier workloads and overclocking. For the most part, you want your CPU to stay below 80°C when under load (though this may vary by CPU)
80-90°C: If your system is regularly getting to and remaining above 80°C you may need to consider improving your cooling efficiency or troubleshooting some common issues. This is especially concerning if you’re reaching these temperatures when not gaming or running resource intensive applications.
It’s worth noting that some processors are designed to run at these higher temperatures and be fine, so again, check your manufacturers specifications if you’re unsure. Other factors such as the size of your PC can affect the ‘normal’ operating temperatures of your CPU as well.
90°C or above: This can be a cause for concern, depending on your CPU, and if temperatures are exceeding 95°C, you should reduce the workload on your system to avoid any permanent damage to your components. It’s at this point you will frequently see signs of thermal throttling.
As mentioned above, these are general indicators of temperatures and their meanings. You should be aware of the CPU manufacturers ‘Temperature Junction Maximum’ (TJ Max) temperature, which is the temperature they list as the maximum operating temp for their chip.
How do I know if my CPU is overheating?
Generally, there will be indications that your CPU is overheating. This may look like programs running slowly or lagging or freezing. You may experience your system shutting down without warning, or the fans running more noisily than usual. In some cases, your system may even feel hot to the touch. These are all potential signs that your processor is getting too hot.
How to monitor CPU temps
Windows doesn’t have a built-in way to check CPU temps unfortunately, but there is plenty of third-party software available:
We like using Core Temp because it’s free, as well as being straightforward and easy to understand, but it’s worth noting that (as with a lot of free programs) it will try and install a lot of bloatware on your PC, so make sure you pay attention during the installation and uncheck anything you don’t need. You can download Core Temp here. Once you’ve downloaded Core Temp, open it.
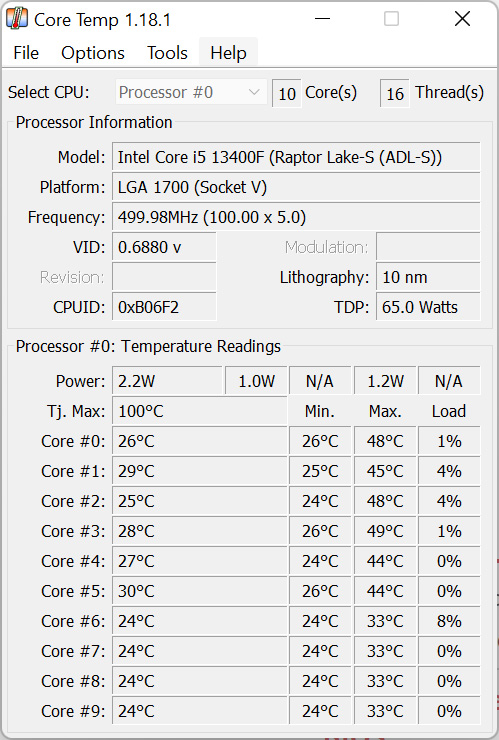
What you’ll see, similar to the screenshot above, is some technical information about your CPU model, followed by a temperature for each core in your CPU (though you may just see one temperature if you’re using an AMD CPU) down the left-hand side. This is measured in real time, so you can leave it open while running various programs and applications to get an idea of your CPU temperature.
In the min and max columns, you will be seeing the minimum and maximum recorded temperatures while the program runs. In the example above, the absolute maximum temperature that any core reaches at minimal workload is 49°C which is well within a safe and normal range for the CPU.
On Windows, after you’ve installed Core Temp, you can click the ‘show hidden icons’ arrow in the system tray (at the bottom right of your taskbar) to quickly see a snapshot of your core temperatures.
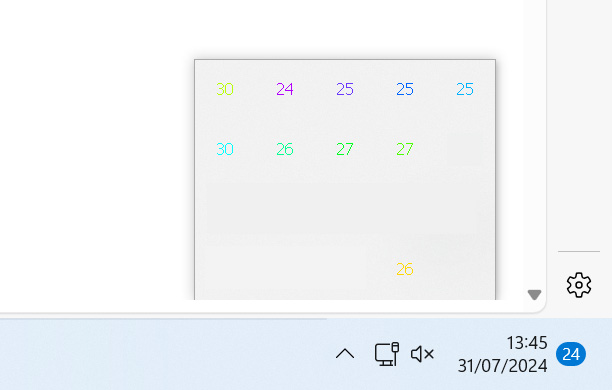
You can drag these numbers on to your task bar for constant temperature monitoring, or you can go into Core Temp > Options > Settings and select the Notification Area tab. Under Notification area icons, change the radial from ‘All cores’ to ‘Highest temperature per processor’. Now, when you drag the temp on to your task bar, it will be displaying the highest temperature across all cores.

If you want to check the peak temperatures of your system, you can use a tool like Prime95 to run a stress test. The program places the CPU under high-load stress so run it for a maximum of 30 minutes and monitor your system throughout. You can then check Core Temp to see the maximum temperature recorded during the test.
Finally, you can use Core Temp to check your CPU temperature while gaming, though you won’t be able to get an on-screen display. Instead, you should game for at least an hour, and then go back to your desktop and check Core Temp to see the maximum recorded temperature.
How to check CPU temps with BIOS
Windows does include a CPU temperature check within BIOS/UEFI, though its worth noting that this readout only checks the current temperature of your PC and won’t give you any indication of your systems temperature as you’re using your PC, so it’s not always helpful, especially if you want to know your CPU temp while gaming.
To access your BIOS/UEFI, you should restart your computer, and as it restarts, interrupt the boot with a key (usually F12, F2, , F8, ESC or DEL). If you’re unsure which button to press for your manufacturer, then pay attention to the first screen that shows as your PC restarts, as this will tell you the correct key.
Once you’ve successfully entered the BIOS, you should see the CPU temperature displayed on the main page, under the Hardware Monitor section (although this is sometimes called something similar).
How to monitor your temperatures while gaming
Core Temp and similar software is great for monitoring your CPU temps when your taskbar is visible but if you’re gaming, then most of the time, you’re going to be playing in full screen and the taskbar won’t be on the screen. If gaming is what you use your PC for the most, then it’s understandable that you would want to see how your PC performs under a practical workload.
Luckily, there is a great tool for this which is part of MSI afterburner, called RivaTuner CPU temp monitor and its easy to set up and install.
- Download and install MSI Afterburner and RivaTuner
- Double click the MSI Afterburner shortcut on your desktop

3. Click the cog on the left-hand side of the Afterburner window to open the settings, and then select ‘Monitoring’ from the tabs at the top.
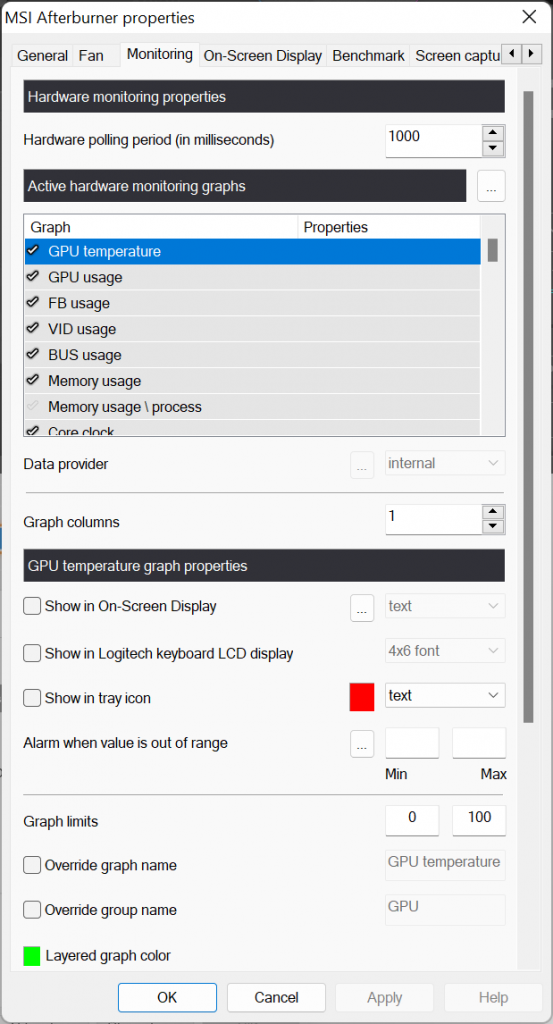
4. In the monitoring section, under the ‘Active hardware monitoring graphs’, scroll down the list until you find CPU temperature. Click to highlight it, and then in the ‘CPU temperature graph properties’, tick ‘Show in On-Screen Display’. And then apply these settings.
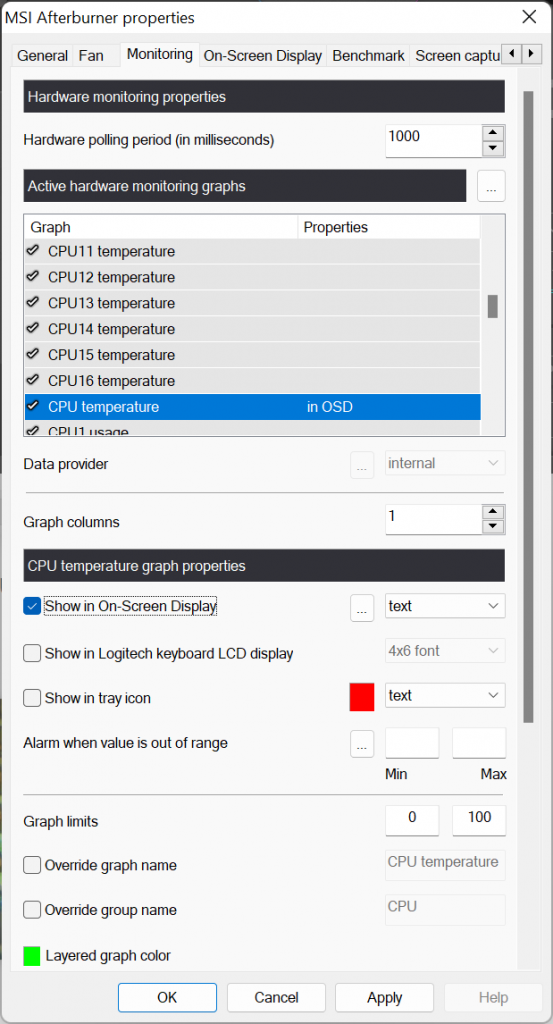
5. Now when you launch your game, you should see your CPU temps show automatically on screen, making it easy to monitor while gaming. MSI Afterburner is great because it can show you a whole load of information about your system performance on-screen, in addition to the CPU thermometer.
Why is my CPU temp so high and how do I fix it?
So now you know how to test and monitor your CPU temp in a range of different applications and under various levels of stress and strain, but what happens if your CPU temp readouts are showing consistently high temperatures, or you’re starting to notice some of the symptoms of an overheating CPU.
Well luckily, there are some pretty common causes of high CPU temperatures that you can troubleshoot in order to try and fix the issue.
Too many processes running at once
A common problem that’s easy to fix, especially in older systems, is that you might just have too much running at once. Luckily, there are some simple checks that you can do. Firstly, on your desktop, hit ‘CTRL’ + ‘SHIFT’ + ‘ESC’ to enter task manager (or you can hit ‘CTRL’ + ‘ALT’ + ‘DEL’ and select task manager from the list. From here, in the processes tab, you can see your CPU usage as a percentage, as well as the current apps and background processes you have running and what percentage of CPU usage they are using.
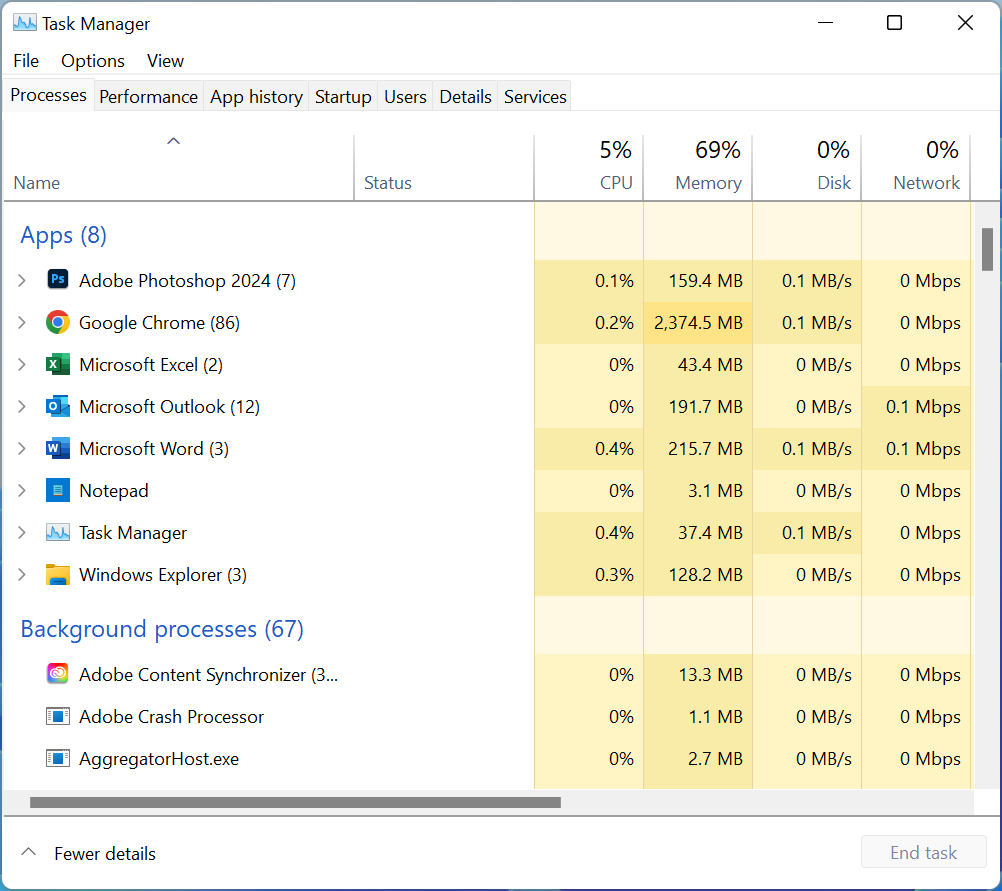
Try shutting down some unnecessary background processes, or apps to reduce the load on your CPU.
Too many browser tabs open
Some browsers are more guilty of this than others (naming no names), but if you’re the kind of stress-inducing person that never closes a tab and always has hundreds of windows open at any one time, then it might be time to start clicking that little ‘x’. Having lots of tabs open can require more resources, which means your PC has to work harder. Its usually a minor thing, but it’s worth checking.
Fans aren't working correctly
With the basics checked, it’s time to check that everything in your system is working as expected. Firstly, check your fans for obvious dust or build up and remove that. You’d be surprised at how little dust it takes to stop a fan performing efficiently. Once your fans are clean and dust-free, visually check that they are all spinning and there aren’t any obvious broken fans, and pay attention to how they sound. If a fan is louder than usual, this can be a warning sign. If everything looks okay visually, the next step would be to check that your fans are correctly set to intake/outtake and that they are running at a sufficient RPM to cool your system.
Air vents have become blocked
A common issue we see that causes high CPU temperatures is an excessive build up of dust, dirt and grime. If you’re not regularly deep cleaning the internal parts of your system, this should be your first check as this build up can block ventilation, reducing the effectiveness of airflow around your critical components. We recommend picking up a bottle of canned air, getting the vacuum out and getting your hands dirty, giving your system a thorough cleaning, before testing again, as very often, this can be a simple fix to this problem.
Not enough or no thermal paste
Over time, due to usage, thermal paste dries up and a lot of people don’t realise this is something you need to replace. On average, you should be checking there is sufficient thermal paste every three years. If there isn’t a good amount of paste, then heat won’t be properly dissipated between the CPU and cooler, which can cause the CPU temperatures to rise. If you’re comfortable replacing the thermal paste in your system, then make sure you use some rubbing alcohol to remove the remnants of the old paste first, to give you a good surface for a fresh layer.
Software isn't up-to-date
If you have outdated software on your system then you may have missed out on some improved efficiencies. This means the old system can be putting unnecessary stress on your system, so its worth checking that you’re up-to-date with the latest software.
You have a virus or some form of malware
Viruses or malware can make your PC run harder than it has to and this overworking can cause overheating issues. Make sure you’re running regular scans and that you have good anti-virus / anti-malware software installed.
Cooler isn't adequate
Not all CPU coolers are created equal, and not all CPU coolers are compatible with all CPUs. To check your CPU coolers compatibility, there are a few things you need to look at:
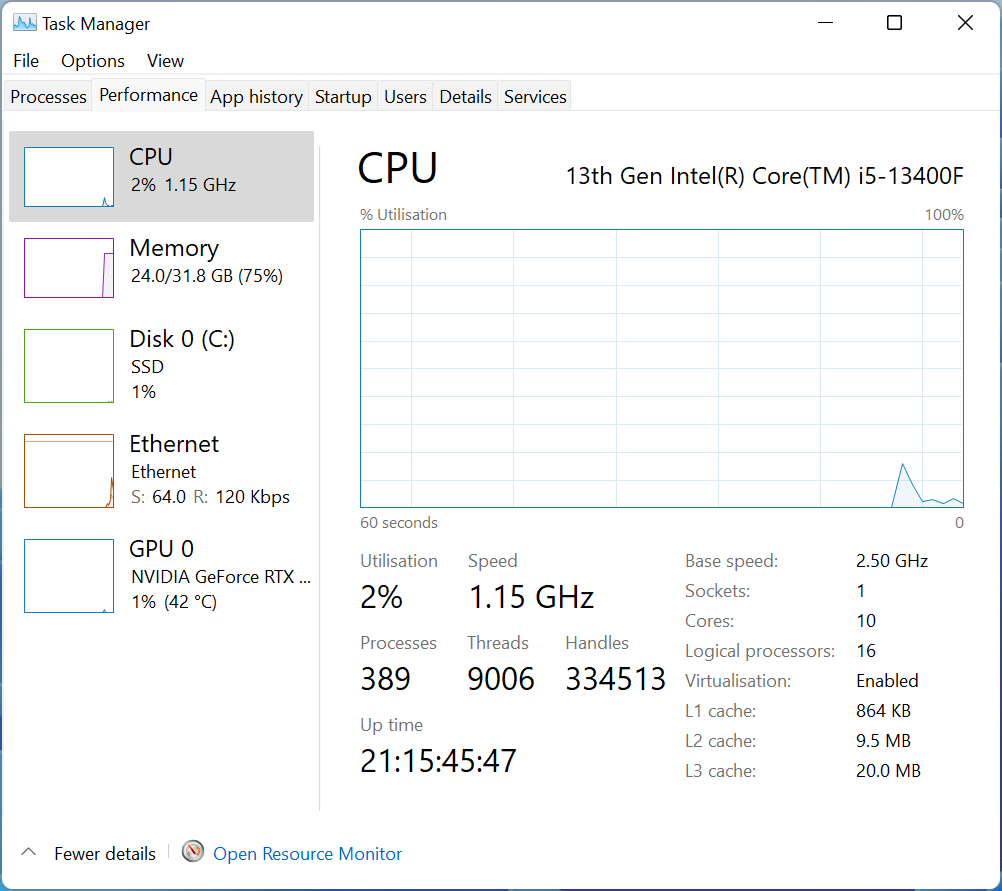
- Find out what your CPU socket type is: We recommend looking at your manufacturers documentation for your processor to determine your CPU socket type. If you’re unsure what CPU you have, you can check by going to task manager, go to the performance tab and you will see your CPU model.
2. Check your CPU Cooler socket is compatible: Now you know what your CPU socket is, you can check that your cooler is compatible. Each CPU cooler has been designed to fit specific sockets, so take a look at the manufacturer’s documentation for your specific cooler and check that it is compatible with your CPU socket. At this point, you should check your CPU heat sink hasn’t come loose.
3. Check TDP ratings: Finally, you should check the Thermal Design Power (TDP) ratings of both your CPU cooler and CPU. TDP is a value that represents the maximum amount of heat that a CPU cooler is designed to dissipate. If the TDP rating of your CPU cooler is lower than the TDP rating of your CPU, this can cause your CPU to overheat.
CPU Cooler has failed
If your CPU temperature is high, it may be indicative of an issue with your CPU cooler, such as; the CPU cooler has failed or there is a connection issue somewhere, be it an AIO CPU cooler pump failing, an air cooler fan failing to spin anymore, or if you have a custom loop and the pump that circulates the liquid around the custom loop has failed.
How to tell if AIO has failed: If there is a 0 RPM reading within the BIOS for the header that the pump is attached to. This will only be possible if the pump cable is connected directly to a fan header on the motherboard. It is also worth checking the connections coming from the pump and the radiator fans to ensure that nothing has come loose.
How to tell if an air cooler fan has failed: If the fan no longer spins when you can see that it is connected to the CPU fan header then you likely have a failed air cooler fan. You can also connect the CPU fan to a chassis header to verify if the issue is related to the CPU fan header or not.
How to tell if custom loop pump has failed: You can tell if your custom loop pump has failed by placing your hand on the pump and if you don't feel the pump vibrating anymore, and you have checked the power connection from the pump and that's fine, then it's more than likely failed.
Case doesn't have adequate airflow
CPU temperatures can increase if your PC case doesn't have adequate airflow or fans. If your case is restricted, with very minimal airflow design, or if there aren't enough case fans to provide sufficient cooling, this can cause increased CPU temps.
Overclocking
If you have overclocked your CPU, you are deliberately putting it under additional strain which is going to increase the heat output of your system. This will be especially noticeable if you haven’t correctly optimised your components after overclocking them. If you are worried that overclocking might be the cause of your issues, we recommend you clock back until you find the tipping point of performance and heat output. Remember, when performing any overclocking, you should work up incrementally and stress test frequently to ensure your system remains stable.
So there you have it, the Fierce PC ultimate guide to testing and monitoring CPU temperatures. Usually, CPU overheating can be a symptom of issues elsewhere in your system, but occasionally, it might be a sign of a more serious issue with your CPU. If the problem persists, the best option might be a new gaming PC. With Fierce PCs prebuilt and configurable gaming PC systems, you can rest assured that there will be no compatibility issues between your CPU and CPU cooler, fans will be set up correctly and you will always have sufficient thermal paste. Check out all our gaming PCs to find your latest system today!
If you aren’t looking for a whole new system, we also offer motherboard and CPU upgrade bundles as well as processor air coolers and processor AIO liquid coolers to make sure your PC is running as optimally as possible.
If you have any questions about your CPU temps or you need support running through any of the troubleshooting steps in this guide, you can contact our expert customer service team, Monday-Friday, 9am – 5.30pm on 01706 214 233 or at [email protected].